

India Transmission Infrastructure Market Size & Forecast 2032
- Energy, Power & Storage, Grid & Power Infrastructure
- Oct 2026
- Pages 140
- Report Format: pdf
- Report Price: $2400 USD
Summary: India’s transmission infrastructure investment is witnessing strong structural growth, driven by the INR 9.15 lakh crore National Electricity Plan pipeline, accelerating renewable energy zone evacuation, mounting curtailment and stranded generation capacity, wider private participation through tariff based competitive bidding, asset monetisation via infrastructure investment trusts, and rising interest from domestic and global developers investing in India-specific corridors, converter stations, and grid automation platforms.
| Study Duration | 2021-2032 |
| Market Size (2025) | USD 7,450 Million |
| CAGR (2026-2032) | 13.3% |
| Leading Segment | Transmission Lines & Towers (400 kV AC, ISTS) |
| Fastest Growing Segment | HVDC Systems & RE Zone Evacuation |
| Market Size (2032) | USD 17,800 Million |
India Transmission Infrastructure Market Overview
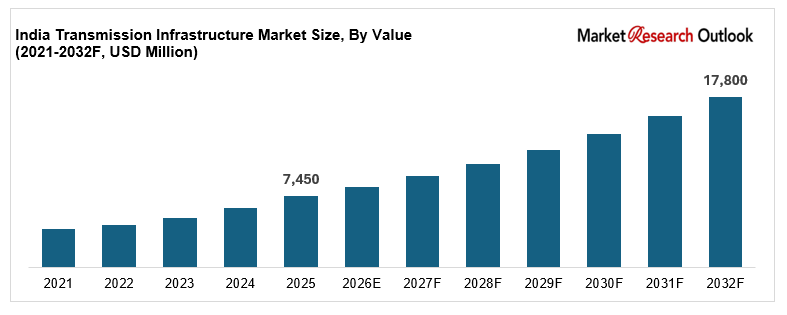
The India transmission infrastructure investment market size is witnessing rapid expansion, driven by a ten-year national plan, accelerating renewable capacity additions, mounting curtailment in renewable-rich states, wider private participation through competitive bidding, and asset monetisation through infrastructure trusts. Valued at USD 7,450 million in 2025 and projected to reach USD 17,800 million by 2032, growing at a CAGR of 13.3%, the India transmission infrastructure market growth is being fuelled by evacuation schemes across Rajasthan, Gujarat, Tamil Nadu, Karnataka, Andhra Pradesh and Madhya Pradesh. Transmission lines and towers lead the component mix, while high-voltage direct current systems and renewable energy zone evacuation are the fastest growing categories. Slow right-of-way resolution, clearance delays and a thin high-voltage equipment supply base are reshaping how projects are priced and awarded. As Power Grid Corporation, Adani Energy Solutions, Tata Power, Sterlite Power and Larsen & Toubro scale delivery, and as lenders widen exposure to grid assets, the Indian power grid is evolving into a plan-led, capital-intensive, and execution-driven sector with strong long-term growth potential.
Related research: India Power Transformer Market, India Distribution Transformer Market and India Electricity Demand Market.
Key Report Takeaways: India Transmission Infrastructure Market
- The India transmission infrastructure investment market size is projected to grow from USD 7,450 million in 2025 to USD 17,800 million by 2032, registering a strong CAGR of 13.3%, driven by the national transmission plan, renewable evacuation urgency, and the structural shift toward high-capacity corridors across the Indian grid.
- Transmission lines and towers dominate the India transmission infrastructure investment market, accounting for 44% of capital spending in 2025, driven by the planned addition of 1,91,000 circuit kilometres by 2032, long evacuation distances from renewable zones, and the cost weight of conductors, towers and right-of-way acquisition.
- High-voltage direct current systems and renewable energy zone evacuation are emerging as the fastest growing segments in the India transmission infrastructure investment market, expected to grow at 21.4% annually as 33 GW of bi-pole links are built and inter-regional capacity rises from 119 GW toward 143 GW.
- The renewable integration bottleneck remains acute, with 300 GWh curtailed in the first quarter of 2026 because of network constraints and more than 50 GW of awarded capacity stranded, structurally expanding the India transmission infrastructure investment market across evacuation, strengthening, and automation categories.
- Rising investment by developers such as Power Grid Corporation, Adani Energy Solutions, Tata Power, Sterlite Power and Techno Electric in corridors, substations and converter stations is strengthening delivery capacity and supporting the India transmission infrastructure investment market forecast 2032.
Key Drivers of the India Transmission Infrastructure Market
National Electricity Plan and the INR 9.15 Lakh Crore Transmission Investment Pipeline to 2032
Growth in the India transmission infrastructure investment market is being driven by a plan that finally sizes the grid to the generation fleet it must carry. The National Electricity Plan for transmission commits to 1,91,000 circuit kilometres of lines and 1,270 GVA of transformation capacity at 220 kV and above between FY2023 and FY2032, alongside 33 GW of high-voltage direct current bi-pole links, presenting an investment opportunity above INR 9,15,000 crore. Inter-regional capacity is set to rise from 119 GW to 143 GW by 2027. The plan is built around 500 GW of non-fossil capacity by 2030 and more than 600 GW by 2032, and it explicitly accommodates 47 GW of battery storage, 31 GW of pumped storage and 10 GW of offshore wind. A separate scheme for integrating over 500 GW of renewable capacity carries 50,890 circuit kilometres at INR 2.44 lakh crore. Independent estimates place spending at INR 5.5 trillion between FY2027 and FY2032, giving unusual visibility across the India transmission infrastructure market.
Renewable Curtailment, Stranded Capacity and Evacuation Urgency Forcing Accelerated Grid Investment
The India transmission infrastructure investment market is benefiting from the rising cost of not building fast enough. In the first quarter of 2026, 300 GWh of renewable generation was curtailed because of network constraints, close to two-thirds of the 470 GWh curtailed across inter-state projects in that period. More than 50 GW of awarded renewable capacity was stranded as of mid-2025, equal to over a quarter of installed green capacity, with Rajasthan alone holding 8 GW unable to evacuate and nearly half of that curtailed during peak solar hours. Around 20 GW is expected to face connectivity delays beyond four months in FY2026-27, and more than 35 GW could face severe curtailment risk in the same year. Every unit curtailed raises the effective cost of renewable power and weakens developer returns, which is why evacuation schemes now carry the same urgency as generation tenders across the India transmission infrastructure market.
Competitive Bidding, Private Participation and Asset Monetisation Widening the Capital Pool
Access to capital remains a major catalyst for the India transmission infrastructure investment market. Tariff based competitive bidding has opened inter-state projects to private developers alongside Power Grid Corporation, which still wins a large share of schemes, with Adani Energy Solutions, Tata Power, Sterlite Power, GR Infraprojects and Techno Electric building substantial order books. Infrastructure investment trusts and asset monetisation are recycling capital out of commissioned lines and back into new construction, shortening the funding cycle for developers. State transmission utilities are running parallel programmes under green energy corridor schemes, while equipment makers including Siemens Energy, Hitachi Energy, GE Vernova, Apar Industries, Kalpataru Projects and KEC International expand conductor, transformer, switchgear and tower capacity to match award volumes. Deeper competition and a wider funding base together support delivery across the India transmission infrastructure market through 2032.
India Transmission Infrastructure Market Challenges
Right-of-Way Disputes, Land Acquisition and Clearance Delays Slowing Project Commissioning
The India transmission infrastructure investment market continues to face execution risk at the point where plans meet land. Around one in four inter-state schemes runs a year or more behind schedule, and 25% of projects planned for completion by FY2026-27 are already delayed by more than twelve months. Right-of-way disputes, fragmented land ownership, and forest and biodiversity clearances are the primary causes, and these are structural issues that additional capital alone will not resolve quickly. Over the past five years India has delivered only about 80% of its annual transmission targets, feeding a backlog against a requirement of 61,411 circuit kilometres of additional inter-state capacity by FY2029-30. Only 12% of competitively bid projects have been completed on schedule. Until clearance and land processes move at the pace of award activity, delivery will remain the binding constraint on the India transmission infrastructure market.
Thin Global Supply Base for HVDC Components, Transformers and Conductors Stretching Delivery
The India transmission infrastructure investment market faces structural complexity in sourcing high-voltage equipment. A small group of global suppliers manufactures converter valves, large power transformers, reactors and gas-insulated switchgear at the ratings Indian corridors require, and worldwide grid investment has tightened that queue at the same time. Lead times for converter stations and high-capacity transformers have stretched well beyond the periods assumed when many schemes were bid, while conductor and tower steel pricing has moved with commodity cycles. Developers bidding fixed transmission charges over 35-year licence periods carry that exposure directly. Domestic capacity expansion by Siemens Energy, Hitachi Energy, GE Vernova, BHEL, Apar Industries and Kalpataru Projects is closing part of the gap, but ramp-up takes time, leaving equipment availability a live risk across the India transmission infrastructure market.
Low Corridor Utilisation and Planning Mismatch Between Generation and Grid Build Cycles
The India transmission infrastructure investment market faces practical constraints around how built assets are actually used. Analysis indicates that up to 71% of inter-state corridors operate below 30% of rated loading, a mismatch between where capacity exists and where power actually flows, which raises per-unit transmission charges for every user. The timing problem compounds it: a solar project can reach commissioning in as little as 12 months, while an inter-state line can take as long as 60 months from planning to energisation. Generation tenders, connectivity grants, general network access and power purchase agreements are cleared by different agencies on different clocks, so capacity arrives before the wires or the wires arrive before the buyers. Integrated planning, storage-linked corridor design and dynamic line rating are the recognised responses, but each requires coordination that the India transmission infrastructure market is still building.
India Transmission Infrastructure Market Trends
HVDC and 765 kV Backbone Build-Out From Renewable Zones to Distant Load Centres in India
The India transmission infrastructure investment market is undergoing a clear shift toward higher voltages and longer hauls. High-voltage direct current systems account for 14% of capital spending in 2025 and are rising fast, with 33 GW of bi-pole links planned through 2032 and operating voltage ambitions extending to 1,200 kV alternating current. The 400 kV class still carries 33% of spending and 765 kV a further 24%, but the growth is concentrated at the top of the voltage stack because renewable generation sits in Rajasthan, Gujarat and the southern wind belts while demand sits in the north, west and along the industrial corridors. Inter-regional capacity is planned to reach 143 GW by 2027 from 119 GW. Hybrid substations, series compensation and static compensators are being specified alongside the lines themselves. This transition is reinforcing the India transmission infrastructure market forecast 2032 across both central and state programmes.
Private Transmission Developers, Competitive Bidding and InvIT-Led Asset Monetisation
A visible broadening of ownership is reshaping the India transmission infrastructure investment market. Tariff based competitive bidding accounts for 38% of capital deployed, ahead of the regulated tariff mechanism at 18%, with state transmission utilities holding 31% and joint ventures and infrastructure trusts making up the balance. Power Grid Corporation remains the single largest licensee, while Adani Energy Solutions, Tata Power, Sterlite Power, GR Infraprojects, Techno Electric and Kalpataru Projects have built sizeable competitively won portfolios. Infrastructure investment trusts have become the standard exit for commissioned assets, releasing equity for the next construction cycle and drawing pension and sovereign capital into Indian grid assets. The trade-off is aggressive tariff bidding against equipment cost inflation, which is why delivery discipline now matters more than headline price across the India transmission infrastructure market.
Storage-Linked Corridors, Dynamic Line Rating and Grid Automation Lifting Asset Utilisation
A wave of utilisation-led investment is reshaping the India transmission infrastructure investment market. With up to 71% of inter-state corridors running below 30% of rated loading, the cheapest incremental capacity is often the corridor already built. The national plan integrates 47 GW of battery storage and 31 GW of pumped storage alongside generation, allowing evening discharge to fill corridors designed around midday solar peaks. Grid automation, protection and supervisory control account for 7% of capital spending and are growing quickly, with wide-area monitoring, substation automation and dynamic line rating letting operators push more power through existing conductors within thermal limits. Combined with 61,411 circuit kilometres of planned inter-state additions and the visibility that gives suppliers, these developments are reinforcing the India transmission infrastructure market forecast 2032 across the entire value chain.
India Transmission Infrastructure Market Share by Segment
By End-User: State Transmission Utilities & Discoms Segment Dominates the Indian Grid Market
The state transmission utilities and distribution companies segment dominates the India transmission infrastructure investment market, accounting for an estimated 34% of capital spending, driven by intra-state network programmes, green energy corridor schemes and the obligation to connect generation inside state boundaries. The 400 kV and 220 kV classes are the dominant configurations within this segment. Private transmission developers contribute another 29% of spending, holding competitively won licences through project vehicles and infrastructure trusts. The central transmission utility and its planning arm account for 26%, led by inter-state corridors, converter stations and inter-regional strengthening. Renewable generators and captive consumers make up 11%, concentrated in dedicated evacuation lines and pooling substations. In 2025, programmes across Rajasthan, Gujarat, Tamil Nadu and Karnataka reinforced segment dominance in the India transmission infrastructure investment market.
By Component: Lines & Towers Lead While HVDC Systems and Grid Automation Grow Fastest
Transmission lines and towers lead the India transmission infrastructure investment market component mix, accounting for approximately 44% of capital spending, driven by the sheer route length planned and the cost weight of conductors, towers, foundations and right-of-way acquisition. Substations and transformation capacity contribute another 27%, in line with the 1,270 GVA planned through 2032. High-voltage direct current systems and converter stations account for 14%, FACTS and reactive compensation 6%, grid automation, protection and supervisory control 7%, and other items the remaining 2%. High-voltage direct current systems and renewable energy zone evacuation are the fastest growing categories within the India transmission infrastructure investment market, expanding at 21.4% annually. Leading contractors including Power Grid Corporation, Adani Energy Solutions, Larsen & Toubro, Kalpataru Projects and KEC International have aligned capability to this mix across the Indian grid.
India Transmission Infrastructure Market by Region
Regional analysis of the India transmission infrastructure investment market shows that North India and West India collectively account for approximately 59% of capital spending, driven by Rajasthan (the largest concentration of stranded solar capacity), Gujarat (offshore wind evacuation and western regional pooling), Haryana, Punjab, Maharashtra and Madhya Pradesh, where generation density has outpaced network build. South India contributes around 22% of spending, led by Tamil Nadu, Karnataka and Andhra Pradesh, supported by wind evacuation and inter-regional links. East India accounts for 11%, supported by West Bengal, Odisha and Jharkhand, where thermal corridors and grid strengthening dominate, while Central India accounts for 8%, led by Chhattisgarh and central pooling stations. In 2025, award activity and construction across Rajasthan, Gujarat and Tamil Nadu reinforced these delivery hubs across the India transmission infrastructure investment market.
Recent Developments in the India Transmission Infrastructure Market
- The India transmission infrastructure investment market recorded strong momentum in planning and awards during 2025 and 2026. The National Electricity Plan for transmission set out 1,91,000 circuit kilometres of lines, 1,270 GVA of transformation capacity and 33 GW of high-voltage direct current bi-pole links across FY2023 to FY2032, with an investment opportunity above INR 9,15,000 crore. The government placed the requirement for additional inter-state capacity at 61,411 circuit kilometres by FY2029-30. Independent analysis put sector spending at INR 5.5 trillion between FY2027 and FY2032, with network length expected to reach 6,00,000 circuit kilometres by March 2030 on annual additions near 19,500 circuit kilometres.
- Bottleneck evidence hardened through the year across the India transmission infrastructure investment market. Curtailment attributable to network constraints reached 300 GWh in the first quarter of 2026, close to two-thirds of the 470 GWh curtailed on inter-state projects. Stranded renewable capacity passed 50 GW, with the government placing the figure at 44 GW, while 20 GW faced connectivity delays beyond four months in FY2026-27. Analysis found that 25% of schemes due by FY2026-27 were already more than a year late and that only 12% of competitively bid projects finished on schedule, sharpening the case for integrated planning.
- Capacity and ownership structures continued to evolve in the India transmission infrastructure investment market. Power Grid Corporation retained the largest licensee position while Adani Energy Solutions, Tata Power, Sterlite Power, GR Infraprojects, Techno Electric and Kalpataru Projects expanded competitively won portfolios and moved commissioned assets into infrastructure investment trusts. Equipment suppliers including Siemens Energy, Hitachi Energy, GE Vernova, Apar Industries and KEC International added transformer, switchgear, conductor and tower capacity, strengthening long-term positioning in the India transmission infrastructure investment market forecast 2032.
Key Companies in the India Transmission Infrastructure Market
- Power Grid Corporation of India Limited
- Adani Energy Solutions Limited
- Tata Power Company Limited
- Sterlite Power Transmission Limited (Resonia Limited)
- Larsen & Toubro Limited
- Kalpataru Projects International Limited
- KEC International Limited
- Siemens Energy India Limited
- Hitachi Energy India Limited
- GE Vernova T&D India Limited
- Apar Industries Limited
- Techno Electric & Engineering Company Limited
- GR Infraprojects Limited
| By Component | By Voltage Level | By Ownership | By Project Type | By End-User |
| Lines & Towers Substations HVDC FACTS Grid Automation Others | 765 kV 400 kV 220 kV 132 kV & Below 800 kV HVDC 320 kV & 500 kV HVDC Others | TBCB Regulated Tariff State Utility Joint Venture InvIT | ISTS Intra-State RE Zone Evacuation Green Corridor Cross-Border Grid Strengthening | Central Utility State Utilities & Discoms Private Developers RE Generators |
Report Scope
In this report, the India Transmission Infrastructure Investment Market has been segmented into the following categories, in addition to detailed analysis of key industry trends, market dynamics, competitive landscape, and growth opportunities across the forecast period:
- By Component
- Transmission Lines & Towers
- Substations & Transformation Capacity
- HVDC Systems & Converter Stations
- FACTS, Reactive Compensation & STATCOM
- Grid Automation, Protection & SCADA
- Others
- By Voltage Level
- 765 kV AC
- 400 kV AC
- 220 kV AC
- 132 kV & Below
- 800 kV HVDC
- 320 kV & 500 kV HVDC
- 1,200 kV AC & Others
- By Ownership Model
- Tariff Based Competitive Bidding (TBCB)
- Regulated Tariff Mechanism (RTM)
- State Transmission Utility Owned
- Joint Venture & Special Purpose Vehicle
- InvIT & Asset Monetisation
- By Project Type
- Inter-State Transmission System (ISTS)
- Intra-State Transmission System
- Renewable Energy Zone Evacuation
- Green Energy Corridor Schemes
- Cross-Border Interconnection
- Grid Strengthening & Upgradation
- By End-User
- Central Transmission Utility & CTUIL
- State Transmission Utilities & Discoms
- Private Transmission Developers
- Renewable Generators & Captive Consumers
- By Geography
- North India
- South India
- West India
- East India
- Central India
Competitive Landscape
Company Profiles:
Detailed analysis of the leading companies operating in the India Transmission Infrastructure Investment & Renewable Integration Bottleneck Market, including business overview, project portfolio, strategic initiatives, competitive positioning, and recent developments.
Company Information
Detailed profiling and strategic analysis of additional market players (up to five companies), including emerging transmission developers, specialty high-voltage equipment suppliers, regional EPC contractors, or niche grid automation and software providers.
For a free sample of the India Transmission Infrastructure Investment & Renewable Integration Bottleneck Market report, customised insights or delivery timelines, submit your query here
India Transmission Infrastructure Investment & Renewable Integration Bottleneck Market, 2032
- Research Framework
- Market Segmentation
- Research Objective
- Research Methodology
- Qualitative Research
- Primary Research
- Secondary Research
- Quantitative Research
- Market Breakdown & Data Triangulation
- Demand Side
- Supply Side
- Primary Research Respondents
- Assumption & Limitation
- Executive Summary
- Market Overview, 2021-2032
- By Component
- By Voltage Level
- By Ownership Model
- By Project Type
- By End-User
- By Region
- Analyst Recommendations
- Geopolitical Impact on India Transmission Infrastructure Investment Market
- India Transmission Infrastructure Investment Market Insights
- Market Dynamics
- Growth Drivers
- National Electricity Plan and the INR 9.15 lakh crore transmission infrastructure pipeline to 2032.
- Renewable curtailment, stranded capacity and evacuation urgency forcing accelerated transmission infrastructure investment.
- Tariff based competitive bidding, private participation and asset monetisation widening the capital pool.
- Restraints
- Right-of-way disputes, land acquisition and forest clearances delaying one in four ISTS schemes in India.
- Thin global supply base for HVDC components, transformers and conductors stretching delivery timelines.
- Chronic under-delivery against annual targets, with only 80% of the transmission infrastructure plan met over five years.
- Opportunities
- HVDC corridors and high-capacity 765 kV links driving transmission infrastructure investment toward renewable zones.
- InvIT and asset monetisation routes releasing capital for the next round of transmission investment.
- Grid automation, dynamic line rating and storage-linked corridors lifting utilisation of existing assets.
- Challenges
- Mismatch between fast generation build cycles and far longer transmission infrastructure delivery times.
- Low corridor utilisation, with up to 71% of ISTS transmission infrastructure operating below 30% of rated loading.
- Coordinating connectivity, general network access and power purchase timelines across agencies and states.
- Technological Advancements
- Recent Technological Advancements
- Prior to 2020
- Porter’s Five Forces Analysis
- PESTLE Analysis
- Industry Value Chain & Entry Points
- Grid Planning & Study Agencies (CEA, CTUIL, Grid Controller of India, state utilities)
- Conductor, Cable & Insulator Manufacturers (Apar Industries, Sterlite Technologies, Polycab)
- Transformer, Reactor & Switchgear Makers (Siemens Energy, Hitachi Energy, GE Vernova, BHEL)
- HVDC & FACTS Technology Suppliers (converter valves, STATCOM, series compensation systems)
- Tower Fabrication & Galvanising Units (Kalpataru Projects, KEC International, Skipper)
- Grid Automation, Protection & SCADA Providers (substation automation, wide-area monitoring)
- Transmission EPC & Line Stringing Contractors (right of way, foundations, erection, testing)
- Transmission Licensees & Developers (Power Grid, Adani Energy Solutions, Tata Power, Resonia)
- Lenders, InvITs & Infrastructure Funds (project finance, asset monetisation, refinancing)
- End-Users (renewable generators, distribution utilities, open access and industrial consumers)
- India Transmission Infrastructure Investment Market: Regulatory Framework
- India Transmission Infrastructure Investment Market Overview
- Market Size & Forecast, 2021-2032
- By Value (USD Million)
- By Volume (Circuit Kilometres)
- Market Share & Forecast
- By Component
- Transmission Lines & Towers
- Substations & Transformation Capacity
- HVDC Systems & Converter Stations
- FACTS, Reactive Compensation & STATCOM
- Grid Automation, Protection & SCADA
- Others
- By Voltage Level
- 765 kV AC
- 400 kV AC
- 220 kV AC
- 132 kV & Below
- 800 kV HVDC
- 320 kV & 500 kV HVDC
- 1,200 kV AC & Others
- By Ownership Model
- Tariff Based Competitive Bidding (TBCB)
- Regulated Tariff Mechanism (RTM)
- State Transmission Utility Owned
- Joint Venture & Special Purpose Vehicle
- InvIT & Asset Monetisation
- By Project Type
- Inter-State Transmission System (ISTS)
- Intra-State Transmission System
- Renewable Energy Zone Evacuation
- Green Energy Corridor Schemes
- Cross-Border Interconnection
- Grid Strengthening & Upgradation
- By End-User
- Central Transmission Utility & CTUIL
- State Transmission Utilities & Discoms
- Private Transmission Developers
- Renewable Generators & Captive Consumers
- By Geography
- North India
- South India
- West India
- East India
- Central India
- Competitive Landscape
- India Transmission Infrastructure Investment Market Company Market Share Analysis, 2025
- Competitive Benchmarking, By Operating Parameters
- Key Strategic Development (Mergers, Acquisitions, Partnerships, Etc.)
- List of Emerging Players
- Company Profile
- Power Grid Corporation of India Limited
- Introduction & Company Profile
- Product Benchmarking
- Strategic Outlook
- Key Competitors
- Financial Analysis
- SWOT Analysis
(Same Data Pointers Will Be Provided for The Below Companies)
- Adani Energy Solutions Limited
- Tata Power Company Limited
- Sterlite Power Transmission Limited (Resonia Limited)
- Larsen & Toubro Limited
- Kalpataru Projects International Limited
- KEC International Limited
- Siemens Energy India Limited
- Hitachi Energy India Limited
- GE Vernova T&D India Limited
- Apar Industries Limited
- Techno Electric & Engineering Company Limited
- GR Infraprojects Limited
- Other Prominent Players
* Financial information in case of non-listed companies will be provided as per availability
** The segmentation and the companies are subjected to modifications based on in-depth secondary for the final deliverable
Frequently Asked Questions
1. How large is the India transmission infrastructure investment market and what is its growth forecast?
Ans: The India transmission infrastructure investment market is valued at USD 7,450 million in 2025 and is projected to reach USD 17,800 million by 2032, growing at a CAGR of 13.3% on annual capital spending.
2. Which segments are driving demand in the India transmission infrastructure investment market?
Ans: Transmission lines and towers lead with 44% of capital spending, while high-voltage direct current systems and renewable energy zone evacuation are the fastest growing segments across central and state programmes.
3. What are the key drivers of growth in the India transmission infrastructure investment market?
Ans: Key drivers include the INR 9.15 lakh crore national transmission plan, rising renewable curtailment, more than 50 GW of stranded generation capacity, tariff based competitive bidding, and asset monetisation through infrastructure investment trusts.
4. Which regions are driving growth in the India transmission infrastructure investment market?
Ans: North India and West India lead with around 59% of capital spending, driven by Rajasthan, Gujarat, Haryana and Maharashtra. South India follows at 22%, led by Tamil Nadu, Karnataka and Andhra Pradesh.
5. What are the latest trends in the India transmission infrastructure investment market?
Ans: Latest trends include HVDC and 765 kV backbone build-out, competitively bid private ownership, infrastructure trust asset monetisation, and storage-linked evacuation corridors with dynamic line rating to lift utilisation of existing grid assets.