

India Renewable Energy Curtailment Market Size & Forecast 2032
- Battery Storage & Materials, Energy, Power & Storage, Renewables & Clean Fuels
- Oct 2026
- Pages 140
- Report Format: pdf
- Report Price: $2400 USD
| Study Duration | 2021-2032 |
| Market Size (2025) | USD 540 Million |
| CAGR (2026-2032) | 32.8% |
| Leading Segment | Co-Located Battery Storage (Two-Hour Systems) |
| Fastest Growing Segment | Standalone Storage & Long Duration Pumped Hydro |
| Market Size (2032) | USD 3,940 Million |
India Renewable Energy Curtailment Market Overview
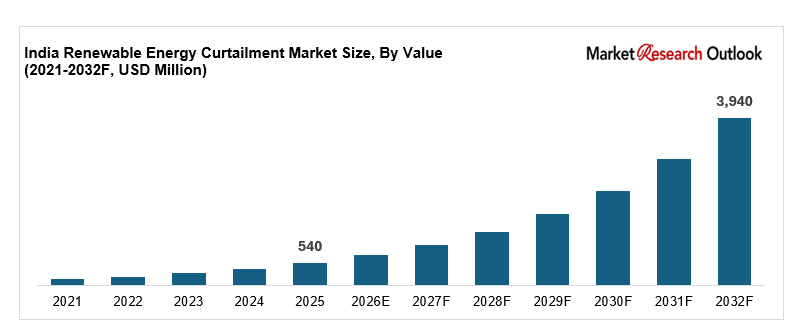
The India renewable energy curtailment market size is witnessing rapid expansion, driven by rising backdown volumes in the northern and western grids, falling levelised cost of storage, firm and dispatchable tender design, must-run protection under the Indian Electricity Grid Code, and connectivity headroom already available at pooling stations. Valued at USD 540 million in 2025 and projected to reach USD 3,940 million by 2032, growing at a CAGR of 32.8%, the India renewable energy curtailment market growth is being fuelled by mitigation contracted across Rajasthan, Gujarat, Maharashtra, Madhya Pradesh, Karnataka and Andhra Pradesh. Co-located battery storage leads the solution mix, while standalone storage under firm tenders and long duration pumped hydro are the fastest growing categories. Transmission congestion causes 64% of recorded backdown. As Tata Power Renewable Energy, Adani Green Energy, ReNew, JSW Energy and Greenko contract storage against exposure, the Indian storage economics market is evolving into a contract-led, regulation-shaped, and location-specific sector with strong long-term growth potential.
Related research: India Transmission Infrastructure Market, India Distribution Transformer Market and India Electricity Demand Market.
Key Report Takeaways: India Renewable Energy Curtailment Market
- The India renewable energy curtailment market size is projected to grow from USD 540 million in 2025 to USD 3,940 million by 2032, registering a strong CAGR of 32.8%, driven by rising backdown volumes, falling storage cost, and tender design that embeds batteries into renewable procurement.
- Co-located battery storage dominates the India renewable energy curtailment market, accounting for 31% of value in 2025, driven by the ability to absorb clipped output at the plant boundary, avoid fresh connectivity applications, and use headroom already sanctioned at the pooling station.
- Standalone storage under firm tenders and long duration pumped hydro are emerging as the fastest growing segments in the India renewable energy curtailment market, expected to grow at 41.2% annually as procurement agencies move from energy-only contracts toward availability-based structures.
- Backdown remains concentrated by cause and by geography, with transmission congestion driving 64% of recorded curtailment and South India recording none at all during the first quarter of 2026, structurally shaping where the India renewable energy curtailment market actually spends.
- Rising investment by developers such as Tata Power Renewable Energy, Adani Green Energy, ReNew, JSW Energy and Serentica Renewables in co-located batteries, forecasting systems and firm supply portfolios is strengthening mitigation capability and supporting the India renewable energy curtailment market forecast 2032.
Key Drivers of the India Renewable Energy Curtailment Market
Rising Backdown Volumes and Compensation Costs Making Curtailment Mitigation Commercially Necessary
Growth in the India renewable energy curtailment market is being driven by losses that have become too large to absorb quietly. Inter-state backdown reached 470 GWh during the first quarter of 2026, of which close to 300 GWh traced directly to transmission congestion, roughly 64% of the total. Over an earlier full-year assessment covering 2.3 TWh of curtailed output, compensation worked out at INR 5,750 million at the low end and INR 6,900 million at the high end, equivalent to USD 63 million and USD 76 million, calculated on tariffs of INR 2.5 per kWh and INR 3.0 per kWh, alongside 2.11 million tonnes of unrealised carbon abatement. Renewable plants carry must-run status under the Indian Electricity Grid Code of 2010, so backing down runs through the emergency ancillary route and draws compensation from the deviation and ancillary service pool. Paying generators not to generate satisfies contracts but wastes the asset, which is why mitigation spending is rising across the India renewable curtailment market.
Falling Levelised Cost of Storage Turning Curtailed Generation Into a Saleable Peak Product
The India renewable energy curtailment market is benefiting from an arithmetic that has recently turned favourable. The levelised cost of storage now sits at INR 4.0 per kWh at the low end and INR 4.5 per kWh at the high end, equivalent to USD 44 and USD 50 per MWh, against solar generation near INR 2.5 per kWh, so stored renewable power is delivered at INR 7 per kWh at the low end and INR 8 per kWh at the high end including transmission charges. That sits comfortably below the INR 10 per kWh many states pay for peak procurement, which means shifting a curtailed unit into the evening peak creates value rather than merely avoiding loss. Cost has fallen steeply, from around INR 6.0 per kWh for four-hour storage in 2020 toward a projected INR 3.7 per kWh by 2030. Analysis suggests 3 GW at the low end and 4 GW at the high end of two-hour capacity could absorb most of what is presently backed down across the India renewable curtailment market.
Firm and Dispatchable Tender Design Embedding Storage Directly Into Renewable Procurement
Procurement design remains a major catalyst for the India renewable energy curtailment market. Firm and dispatchable renewable energy tenders now require bundled supply against a defined delivery profile rather than energy whenever the resource allows, which forces storage into the bid rather than leaving it as an optional add-on. Solar plus storage packages have followed, with a December 2024 auction covering 2,000 MW of photovoltaic capacity alongside 1,000 MW and 4,000 MWh of battery storage clearing at INR 3.52 per kWh, a level that would have looked implausible three years earlier. Standalone storage tenders backed by viability gap funding add a third route. Together these structures account for the bulk of contracted mitigation, moving the cost of firming from a post-award dispute into the tariff itself and giving lenders a cash flow they can size debt against in the Indian storage economics market.
India Renewable Energy Curtailment Market Challenges
Compensation Reaching Only Centrally Instructed Backdown and Leaving Intra-State Losses Unrecovered
The India renewable energy curtailment market continues to face a gap between what is measured and what is paid. Compensation applies where the system operator instructs backdown through the emergency ancillary route, drawn from the deviation and ancillary service pool at the energy charge adopted under competitive bidding. Curtailment occurring inside state boundaries typically falls outside that mechanism and goes unrecovered, so a developer facing intra-state congestion carries the loss directly against project returns. Verification compounds the problem, since curtailed units must be estimated from pyranometer readings, comparable plant performance or forecast models rather than metered directly, and claims are contested. A 250 MW solar plant in Rajasthan running at 8% backdown loses 40 million units a year, worth around INR 10 crore at a tariff of INR 2.50 per kWh. Lenders price that uncertainty into debt terms across the India renewable curtailment market.
Contracting Risk Under Temporary Network Access Discouraging Storage Investment at Pooling Stations
The India renewable energy curtailment market faces structural complexity at exactly the locations where mitigation would work best. Roughly 236 GW of plug-and-play battery connectivity headroom already exists at major pooling stations, yet much of the generation feeding those nodes operates under temporary general network access rather than firm entitlement. Plants enter and exit that queue as firm access is granted elsewhere, so a storage developer cannot rely on a stable counterparty at the node and struggles to sign a bankable contract against a supply that may relocate. Proposals to have a government-backed intermediary aggregate temporary access generation and contract it onward to storage developers would remove that risk, as would procuring batteries as a transmission asset with capacity payments socialised across states. Until one of those routes is adopted, headroom will stay unused across the India renewable curtailment market.
Firming Premium and Storage Cost Still Above Plain Solar Tariff for Price-Sensitive Buyers
The India renewable curtailment market faces practical constraints around willingness to pay. A distribution utility comparing a plain solar tariff near INR 2.5 per kWh against firmed supply at INR 7 per kWh sees the headline gap before it sees the avoided peak cost, and procurement committees are judged on tariff rather than on system cost. Utilities under financial stress discount future savings heavily and prefer the cheapest unit available today. Storage contracts also lock capacity payments over 12-year and 15-year tenors, which sits uncomfortably with buyers accustomed to energy-only exposure. Rising cell prices during 2026 reversed part of the cost decline that made the case compelling. Socialising firming cost, bundling it into tender design and demonstrating avoided peak procurement are the recognised responses, but each requires regulatory support the Indian storage economics market is still assembling.
India Renewable Energy Curtailment Market Trends
Storage Economics Crossing the Peak Power Benchmark and Changing the Investment Case in India
The India renewable energy curtailment market is being reassessed around a threshold that has just been crossed. Delivered cost for stored renewable power now lands at INR 7 per kWh at the low end and INR 8 per kWh at the high end, against peak procurement near INR 10 per kWh in many states, so the business case no longer depends on avoided compensation alone. Two-hour systems take 43% of contracted duration because most backdown occurs in a narrow midday window, four-hour systems 27% where overnight shifting is needed, pumped hydro 14%, and hybrid co-optimised configurations 11%. Co-located batteries at 31% of the solution mix lead precisely because they capture clipped output before it reaches the grid interface. This crossing is reinforcing the India renewable curtailment market forecast 2032 across both central and state procurement.
Mandatory Co-Location, Co-Optimised Siting and Storage Procured as a Grid Asset
A visible shift in planning doctrine is reshaping the India renewable energy curtailment market. Analysts increasingly recommend co-optimised planning of transmission build-out and project siting, alongside mandatory co-location of storage at new renewable capacity, so that evacuation, generation and buffering are designed as one system rather than sequenced by separate agencies. A parallel proposal would treat batteries as a transmission element, with capacity payments socialised across beneficiary states in the same way network charges already are, removing the need for each project to find a commercial counterparty. Firm and dispatchable tenders carry 29% of contracting and solar plus storage packages 26%, with standalone storage under viability gap funding at 21%. These structures are steadily converting policy intent into contracted capacity across the Indian storage economics market.
Regional Divergence With South India at Zero Curtailment and the North-West Carrying the Loss
A sharp regional split is reshaping where money is spent in the India renewable energy curtailment market. South India recorded no inter-state backdown at all during the first quarter of 2026, while the northern and western grids absorbed effectively the entire 470 GWh lost, a divergence explained by demand density, inter-regional links and the concentration of solar capacity in Rajasthan and Gujarat. North India accordingly accounts for 41% of mitigation spending and West India 33%, against 12% in the south. More than 50 GW of awarded renewable capacity remained stranded nationally as of mid-2025, with Rajasthan alone holding 8 GW, and up to 71% of inter-state corridors run below 30% of rated loading, so the constraint is location-specific rather than national. Combined with solar at 26% of installed capacity and non-fossil sources at 52%, these developments are reinforcing the India renewable curtailment market forecast 2032.
India Renewable Energy Curtailment Market Share by Segment
By End-User: Renewable Generators & Independent Power Producers Dominate the Market
The renewable generators and independent power producers segment dominates the India renewable energy curtailment market, accounting for an estimated 38% of value, driven by the direct revenue exposure these owners carry when output is backed down and by lender pressure to demonstrate mitigation before financial close. Co-located two-hour batteries are the dominant configuration within this segment. Distribution utilities contribute another 31% of spending, procuring firmed supply to displace expensive peak purchases and to meet round-the-clock obligations. Central procurement agencies and grid operators account for 22%, led by firm and dispatchable tenders and ancillary service contracting. Commercial, industrial and open access consumers make up 9%, concentrated in captive firming arrangements. In 2025, procurement across Rajasthan, Gujarat and Madhya Pradesh reinforced segment dominance in the India renewable energy curtailment market.
By Mitigation Solution: Co-Located Storage Leads While Standalone and Long Duration Grow Fastest
Co-located battery storage leads the India renewable energy curtailment market solution mix, accounting for approximately 31% of value, driven by its ability to capture clipped generation at the plant boundary without a fresh connectivity application. Standalone grid-scale batteries contribute another 24%, forecasting, scheduling and deviation management 14%, pumped hydro and long duration storage 13%, curtailment compensation and deemed generation claims 12%, and demand response with flexible load the remaining 6%. Standalone storage under firm tenders and long duration pumped hydro are the fastest growing categories within the India renewable curtailment market, expanding at 41.2% annually. Transmission congestion accounts for 64% of recorded backdown and system inflexibility a further 17%. Leading developers including Tata Power Renewable Energy, Adani Green Energy, ReNew, Greenko and NTPC Green Energy have aligned portfolios to this mix.
India Renewable Energy Curtailment Market by Region
Regional analysis of the India renewable energy curtailment market shows that North India and West India collectively account for approximately 74% of mitigation spending, driven by Rajasthan, which holds the largest concentration of stranded solar capacity at 8 GW, alongside Gujarat, Madhya Pradesh, Haryana and Maharashtra, where generation density has outpaced evacuation. South India contributes only around 12% of spending despite large renewable capacity, because the southern grid recorded no inter-state backdown during the first quarter of 2026, supported by stronger demand density and inter-regional links across Tamil Nadu, Karnataka, Telangana and Andhra Pradesh. East India accounts for 8%, supported by West Bengal and Odisha, while Central India accounts for 6%, led by Chhattisgarh. In 2025, storage contracting across Rajasthan and Gujarat reinforced these hubs across the India renewable curtailment market.
Recent Developments in the India Renewable Energy Curtailment Market
- The India renewable energy curtailment market recorded significant evidence and policy movement during 2025 and 2026. Analysis placed inter-state renewable backdown at 470 GWh during the first quarter of 2026, with close to 300 GWh attributable to transmission congestion and the remainder to system inflexibility. South India recorded no curtailment at all in that quarter. More than 50 GW of awarded renewable capacity remained stranded nationally as of mid-2025, with Rajasthan holding 8 GW, and up to 71% of inter-state corridors were found to be operating below 30% of rated loading.
- Storage economics improved materially across the India renewable curtailment market. The levelised cost of storage was placed at INR 4.0 per kWh at the low end and INR 4.5 per kWh at the high end, against solar generation near INR 2.5 per kWh, giving delivered stored power at INR 7 per kWh to INR 8 per kWh including transmission charges, comfortably below the INR 10 per kWh many states pay for peak supply. Roughly 236 GW of plug-and-play battery connectivity headroom was identified at major pooling stations, and analysis suggested 3 GW to 4 GW of two-hour capacity could absorb most recorded backdown.
- Contracting structures continued to evolve in the India renewable energy curtailment market. A December 2024 auction covering 2,000 MW of photovoltaic capacity with 1,000 MW and 4,000 MWh of battery storage cleared at INR 3.52 per kWh, establishing a benchmark for bundled firm supply. Proposals advanced to aggregate temporary general network access generation through a government-backed intermediary and to procure storage as a transmission asset with socialised capacity payments, while analysts recommended mandatory co-location, strengthening long-term positioning in the India renewable energy curtailment market forecast 2032.
Key Companies in the India Renewable Energy Curtailment Market
- Tata Power Renewable Energy Limited
- Adani Green Energy Limited
- ReNew Energy Global Plc
- JSW Energy Limited (JSW Neo Energy Limited)
- Greenko Energies Private Limited
- NTPC Green Energy Limited
- Serentica Renewables India Private Limited
- Hero Future Energies Private Limited
- Avaada Energy Private Limited
- O2 Power Private Limited
- Torrent Power Limited
- Waaree Energies Limited (Waaree ESS)
- CleanMax Enviro Energy Solutions Private Limited
| By Mitigation Solution | By Curtailment Cause | By Duration | By Contracting Route | By End-User |
| Co-Located Storage Standalone Storage Pumped Hydro Forecasting Demand Response Compensation | Transmission Congestion System Inflexibility Connectivity Limits Grid Security Scheduling Backdown Others | Two-Hour Four-Hour Six-Hour & Above Pumped Hydro Hybrid | FDRE Tenders Solar Plus Storage Standalone VGF Ancillary & TRAS Bilateral Merchant | Generators & IPPs Distribution Utilities Procurement Agencies C&I Consumers |
Report Scope
In this report, the India Renewable Energy Curtailment & Storage Economics Market has been segmented into the following categories, in addition to detailed analysis of key industry trends, market dynamics, competitive landscape, and growth opportunities across the forecast period:
- By Mitigation Solution
- Co-Located Battery Storage
- Standalone Grid-Scale Battery Storage
- Pumped Hydro & Long Duration Storage
- Forecasting, Scheduling & Deviation Management
- Demand Response & Flexible Load
- Curtailment Compensation & Deemed Generation
- By Curtailment Cause
- Transmission Congestion
- System Inflexibility & Low Demand
- Connectivity & Network Access Limits
- Grid Security & Frequency Events
- Scheduling & Forecast Deviation
- Commercial & Offtake Backdown
- Others
- By Storage Duration
- Two-Hour Systems
- Four-Hour Systems
- Six-Hour & Above
- Pumped Hydro (Long Duration)
- Hybrid & Co-Optimised Configurations
- By Contracting Route
- Firm & Dispatchable Renewable Energy Tenders
- Solar Plus Storage Co-Located Tenders
- Standalone Storage Tenders with Viability Gap Funding
- Ancillary Services & TRAS Procurement
- Bilateral & Captive Firming Contracts
- Merchant & Power Exchange Arbitrage
- By End-User
- Renewable Generators & Independent Power Producers
- Distribution Utilities & Discoms
- Central Procurement Agencies & Grid Operators
- Commercial, Industrial & Open Access Consumers
- By Geography
- North India
- South India
- West India
- East India
- Central India
Competitive Landscape
Company Profiles:
Detailed analysis of the leading companies operating in the India Renewable Energy Curtailment & Storage Economics Market, including business overview, project portfolio, strategic initiatives, competitive positioning, and recent developments.
Company Information
Detailed profiling and strategic analysis of additional market players (up to five companies), including emerging storage developers, specialty forecasting and scheduling providers, regional firming contractors, or niche long duration storage and demand response companies.
For a free sample of the India Renewable Energy Curtailment & Storage Economics Market report, customised insights or delivery timelines, submit your query here
India Renewable Energy Curtailment & Storage Economics Market, 2032
- Research Framework
- Market Segmentation
- Research Objective
- Research Methodology
- Qualitative Research
- Primary Research
- Secondary Research
- Quantitative Research
- Market Breakdown & Data Triangulation
- Demand Side
- Supply Side
- Primary Research Respondents
- Assumption & Limitation
- Executive Summary
- Market Overview, 2021-2032
- By Mitigation Solution
- By Curtailment Cause
- By Storage Duration
- By Contracting Route
- By End-User
- By Region
- Analyst Recommendations
- Geopolitical Impact on India Renewable Energy Curtailment Market
- India Renewable Energy Curtailment Market Insights
- Market Dynamics
- Growth Drivers
- Rising curtailment volumes and compensation costs making renewable energy curtailment mitigation necessary.
- Falling levelised cost of storage turning curtailed renewable generation into a saleable peak product.
- Firm and dispatchable tender design embedding storage directly into renewable procurement in India.
- Restraints
- Compensation reaching only centrally instructed backdown, leaving intra-state curtailment losses unrecovered.
- Contracting risk under temporary network access discouraging storage investment at pooling stations.
- Firming premium and storage cost still above plain solar tariff for the most price-sensitive buyers.
- Opportunities
- Plug-and-play connectivity headroom at pooling stations allowing rapid co-location of battery storage.
- Procuring storage as a transmission asset with capacity payments socialised across states in India.
- Aggregating temporary network access generation and contracting it to storage developers at scale.
- Challenges
- Measuring and verifying curtailed units for deemed generation claims across plants, states and agencies.
- Co-optimising transmission planning, project siting and storage placement across separate institutions.
- Concentration of renewable energy curtailment in a few districts where evacuation is hardest to add.
- Technological Advancements
- Recent Technological Advancements
- Prior to 2020
- Porter’s Five Forces Analysis
- PESTLE Analysis
- Industry Value Chain & Entry Points
- Renewable Generators & Project Developers (solar, wind and hybrid plants exposed to backdown)
- Forecasting & Scheduling Service Providers (qualified coordinating agencies, deviation management)
- Energy Storage Suppliers & System Integrators (battery blocks, power conversion, control software)
- Pumped Hydro & Long Duration Storage Developers (reservoir projects and conversion schemes)
- Load Despatch Centres & Grid Operators (NLDC, RLDC and SLDC dispatch and TRAS instructions)
- Transmission Licensees & Connectivity Providers (pooling stations, evacuation, network access)
- Procurement Agencies & Distribution Utilities (SECI, NVVN, NTPC, state discoms, FDRE tenders)
- Power Exchanges, Traders & Ancillary Markets (day-ahead, real-time and TRAS settlement)
- Lenders, Insurers & Risk Advisors (debt sizing, resource assessment, deemed generation claims)
- End-Users (open access consumers, industry and commercial buyers seeking round-the-clock supply)
- India Renewable Energy Curtailment Market: Regulatory Framework
- India Renewable Energy Curtailment Market Overview
- Market Size & Forecast, 2021-2032
- By Value (USD Million)
- By Volume (GWh Curtailed)
- Market Share & Forecast
- By Mitigation Solution
- Co-Located Battery Storage
- Standalone Grid-Scale Battery Storage
- Pumped Hydro & Long Duration Storage
- Forecasting, Scheduling & Deviation Management
- Demand Response & Flexible Load
- Curtailment Compensation & Deemed Generation
- By Curtailment Cause
- Transmission Congestion
- System Inflexibility & Low Demand
- Connectivity & Network Access Limits
- Grid Security & Frequency Events
- Scheduling & Forecast Deviation
- Commercial & Offtake Backdown
- Others
- By Storage Duration
- Two-Hour Systems
- Four-Hour Systems
- Six-Hour & Above
- Pumped Hydro (Long Duration)
- Hybrid & Co-Optimised Configurations
- By Contracting Route
- Firm & Dispatchable Renewable Energy Tenders
- Solar Plus Storage Co-Located Tenders
- Standalone Storage Tenders with Viability Gap Funding
- Ancillary Services & TRAS Procurement
- Bilateral & Captive Firming Contracts
- Merchant & Power Exchange Arbitrage
- By End-User
- Renewable Generators & Independent Power Producers
- Distribution Utilities & Discoms
- Central Procurement Agencies & Grid Operators
- Commercial, Industrial & Open Access Consumers
- By Geography
- North India
- South India
- West India
- East India
- Central India
- Competitive Landscape
- India Renewable Energy Curtailment Market Company Market Share Analysis, 2025
- Competitive Benchmarking, By Operating Parameters
- Key Strategic Development (Mergers, Acquisitions, Partnerships, Etc.)
- List of Emerging Players
- Company Profile
- Tata Power Renewable Energy Limited
- Introduction & Company Profile
- Product Benchmarking
- Strategic Outlook
- Key Competitors
- Financial Analysis
- SWOT Analysis
(Same Data Pointers Will Be Provided for The Below Companies)
- Adani Green Energy Limited
- ReNew Energy Global Plc
- JSW Energy Limited (JSW Neo Energy Limited)
- Greenko Energies Private Limited
- NTPC Green Energy Limited
- Serentica Renewables India Private Limited
- Hero Future Energies Private Limited
- Avaada Energy Private Limited
- O2 Power Private Limited
- Torrent Power Limited
- Waaree Energies Limited (Waaree ESS)
- CleanMax Enviro Energy Solutions Private Limited
- Other Prominent Players
* Financial information in case of non-listed companies will be provided as per availability
** The segmentation and the companies are subjected to modifications based on in-depth secondary for the final deliverable
Frequently Asked Questions
1. How large is the India renewable energy curtailment market and what is its growth forecast?
Ans: The India renewable energy curtailment market is valued at USD 540 million in 2025 and is projected to reach USD 3,940 million by 2032, growing at a CAGR of 32.8% on mitigation and compensation spending.
2. Which segments are driving demand in the India renewable energy curtailment market?
Ans: Co-located battery storage leads with 31% of value, while standalone storage under firm tenders and long duration pumped hydro are the fastest growing solutions, supported by falling cost and bundled tender design.
3. What are the key drivers of growth in the India renewable energy curtailment market?
Ans: Key drivers include rising backdown volumes, compensation costs under must-run rules, a levelised storage cost near INR 4.0 per kWh, and firm tender design that embeds batteries into renewable procurement.
4. Which regions are driving growth in the India renewable energy curtailment market?
Ans: North India and West India lead with around 74% of mitigation spending, driven by Rajasthan and Gujarat. South India accounts for only 12%, having recorded no inter-state backdown in early 2026.
5. What are the latest trends in the India renewable energy curtailment market?
Ans: Latest trends include stored renewable power undercutting peak procurement cost, mandatory co-location proposals, batteries procured as a transmission asset with socialised payments, and sharp regional divergence in where backdown actually occurs.