

Global Retail Supply Chain Fragility Index Market, By Component (Software & Analytics Platforms, Data Integration & Management Tools, Risk Monitoring & Predictive Analytics Solutions, Consulting & Advisory Services, Managed Services); By Deployment Mode (Cloud-Based, On-Premises, Hybrid); By Enterprise Size (Large Enterprises, Small & Medium Enterprises (SMEs)); By Retail Type (E-commerce & Online Retail, Supermarkets & Hypermarkets, Specialty Stores, Department Stores, Convenience Stores, Omnichannel Retailers); By End User (Retailers, Third-Party Logistics Providers (3PLs), Wholesale Distributors, Supply Chain & Procurement Teams, Market Research & Consulting Firms); By Region (North America, Europe, Asia Pacific (APAC), Latin America (LATAM), Middle East and Africa (MEA)); By Trend Analysis, Competitive Landscape & Forecast, 2021-2032
- Consumer Goods & Retail
- Feb 2026
- Pages 400
- Report Format: pdf
- Report Price: $3500 USD
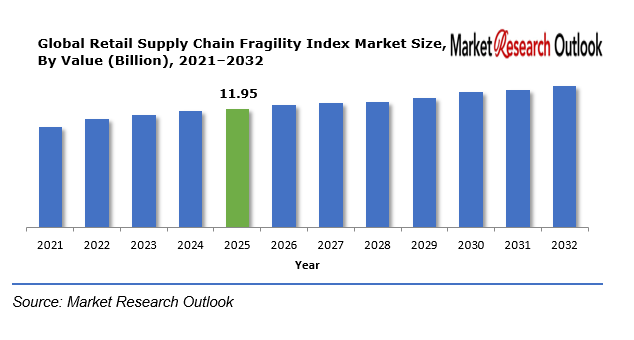
Global Retail Supply Chain Fragility Index Market, Size & Forecast 2021-2032
The Global Retail Supply Chain Fragility Index Market size was estimated at USD 11.95 Billion in 2025. During the forecast period, the Global Retail Supply Chain Fragility Index Market size is projected to grow at a CAGR of 10.4% reaching a value of USD 23.92 Billion by 2032. The market is expected to experience significant growth between 2026 and 2032 because retail businesses increasingly use data-based decision-making and require dependable supply chain networks. The global market expansion needs international suppliers because companies now depend on worldwide sourcing networks which make their supply chains vulnerable to disruptions from geopolitical conflicts and transportation delays and raw material shortages. Retailers and logistics providers use advanced analytics platforms and fragility index tools to detect risks and create emergency response plans. Organizations use artificial intelligence, machine learning, and cloud-based analytics solutions to track supply chain operations in real time, which improves their efficiency and ability to withstand disruptions.
Retail Supply Chain Fragility Index – Overview
The Retail Supply Chain Fragility Index refers to advanced analytical frameworks and digital platforms that assess vulnerabilities and resilience within retail supply chains. The systems assess supply chain stability through their evaluation of supplier reliability and logistics performance and inventory risks and geopolitical influences and demand fluctuations. The fragility index integrates data from multiple sources including enterprise resource planning (ERP) systems and transportation management platforms and market intelligence databases and external risk indicators which include weather conditions and geopolitical developments.
Global Retail Supply Chain Fragility Index Market
Growth Drivers
Rising Supply Chain Disruptions and Risk Awareness
The rising occurrence of worldwide supply chain interruptions has created greater demand for fragility index solutions. The retail supply chain requires proactive risk management because geopolitical conflicts and trade bans and natural disasters and changing fuel and transportation expenses create risks. Retailers and logistics providers use fragility index platforms to track their weaknesses and develop methods to handle them. The rising demand for online shopping together with international trade activities has created more complicated supply chain operations which require instant access to risk information.
Challenges
Data Integration and Implementation Complexity
The Global Retail Supply Chain Fragility Index Market faces its primary obstacle which involves the difficulty of merging various data sources and operating sophisticated analytics systems. Organizations frequently depend on different legacy systems together with supplier databases and logistics platforms which do not easily work with current analytics tools. Organizations need to spend money on technology infrastructure and skilled workers and data management systems for their fragility index solutions.
Geopolitical Impact on Global Retail Supply Chain Fragility Index Market
The Global Retail Supply Chain Fragility Index Market experiences major effects from geopolitical factors which disrupt international trade operations and shipping infrastructure. Trade policies and tariffs together with regional conflicts and economic sanctions create obstacles that disrupt supply chains and block access to products and raw materials. The unpredictable environment creates a need for organizations to acquire advanced analytics solutions which enable them to evaluate risks and sustain their supply chain operations. Cross-border regulations and data governance policies together with international partnerships create obstacles for businesses which want to implement supply chain monitoring platforms. Companies are increasingly focusing on regional diversification of suppliers and localized sourcing strategies to reduce dependency on specific regions.
Global Retail Supply Chain Fragility Index Market
Segmental Coverage
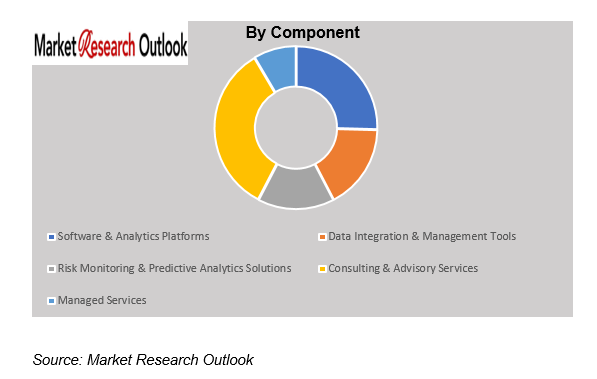
Global Retail Supply Chain Fragility Index Market – By Component
Based on component, the market is segmented into Software & Analytics Platforms, Data Integration & Management Tools, Risk Monitoring & Predictive Analytics Solutions, Consulting & Advisory Services, and Managed Services. The Software & Analytics Platforms segment will experience significant expansion during the forecast period because of rising requirements for real-time supply chain visibility and predictive risk analysis systems. Retailers and logistics providers are adopting advanced analytics tools to monitor supplier performance, transportation efficiency, and inventory risks. Organizations utilize artificial intelligence and machine learning technologies through their integration to discover operational weaknesses while enhancing their supply chain functions. Companies are increasingly turning to consulting and managed services to obtain expert assistance with the proper execution and maintenance of their fragility index solutions.
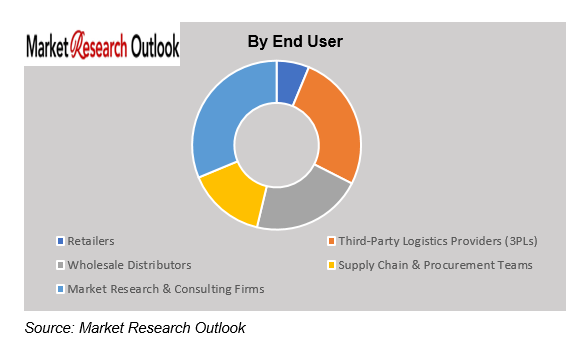
Global Retail Supply Chain Fragility Index Market – By End User
Based on end user, the market is segmented into Retailers, Third-Party Logistics Providers (3PLs), Wholesale Distributors, Supply Chain & Procurement Teams, and Market Research & Consulting Firms. The Retailers segment will lead market growth throughout the forecast period because businesses require better systems to handle their stock and protect themselves from potential dangers. Retail organizations are increasingly using fragility index solutions to sustain supply operations, improve their procurement processes, and increase customer satisfaction. Third-party logistics providers and wholesale distributors use these tools to boost their operational performance while controlling their transportation and supplier-related risks.
Competitive Landscape
Key participants in the Global Retail Supply Chain Fragility Index market include IBM Corporation, SAP SE, Oracle Corporation, Microsoft Corporation, Blue Yonder Group, Inc., Kinaxis Inc., Manhattan Associates, Inc., Infor, Coupa Software Inc., Resilinc Corporation, FourKites, Inc., and Project44, Inc., and other prominent players.
These companies are implementing strategic growth initiatives in order to gain a competitive advantage. The strategies being largely adopted include mergers and acquisitions, strategic alliances, joint ventures, licensing agreements, and new product launches. With the implementation of these strategies, the market participants aim to increase product portfolios, as well as enhance regional presence for long-term sustainable business growth in the Retail Supply Chain Fragility Index industry of Global.
Scope of the Report
| Attributes | Details |
| Years Considered | Historical Data – 2021–2025
Base Year – 2025 Estimated Year – 2026 Forecast Period – 2026–2032 |
| Facts Covered | Revenue in USD Billion |
| Market Coverage | Global |
| Product/ Service Segmentation | Component, Deployment Type, Enterprise Size, Retail Type, End User |
| Key Players | IBM Corporation, SAP SE, Oracle Corporation, Microsoft Corporation, Blue Yonder Group, Inc., Kinaxis Inc., Manhattan Associates, Inc., Infor, Coupa Software Inc., Resilinc Corporation, FourKites, Inc., and Project44, Inc., and other prominent players. |
Market Segmentation
- By Component
- Software & Analytics Platforms
- Data Integration & Management Tools
- Risk Monitoring & Predictive Analytics Solutions
- Consulting & Advisory Services
- Managed Services
- By Deployment Mode
- Cloud-Based
- On-Premises
- Hybrid
- By Enterprise Size
- Large Enterprises
- Small & Medium Enterprises (SMEs)
- By Retail Type
- E-commerce & Online Retail
- Supermarkets & Hypermarkets
- Specialty Stores
- Department Stores
- Convenience Stores
- Omnichannel Retailers
- By End User
- Retailers
- Third-Party Logistics Providers (3PLs)
- Wholesale Distributors
- Supply Chain & Procurement Teams
- Market Research & Consulting Firms
- By Region
- North America
- Europe
- Asia Pacific (APAC)
- Latin America (LATAM)
- Middle East and Africa (MEA)
- Research Framework
- Research Objective
- Product Overview
- Market Segmentation
- Executive Summary
- Global Retail Supply Chain Fragility Index Market Insights
- Growth Drivers
- Restraints
- Opportunities
- Challenges
- Technological Advancements/Recent Developments
- Porter’s Five Forces Analysis
- Industry Value Chain & Entry Points
- Global Retail Supply Chain Fragility Index Market: Regulatory Framework
- Global Retail Supply Chain Fragility Index Market: Marketing Strategies
- Global Retail Supply Chain Fragility Index Market Overview
- Market Size & Forecast, 2021-2032
- By Value (USD Billion)
- Market Share & Forecast
- By Component
- Software & Analytics Platforms
- Data Integration & Management Tools
- Risk Monitoring & Predictive Analytics Solutions
- Consulting & Advisory Services
- Managed Services
- By Deployment Mode
- Cloud-Based
- On-Premises
- Hybrid
- By Enterprise Size
- Large Enterprises
- Small & Medium Enterprises (SMEs)
- By Retail Type
- E-commerce & Online Retail
- Supermarkets & Hypermarkets
- Specialty Stores
- Department Stores
- Convenience Stores
- Omnichannel Retailers
- By End User
- Retailers
- Third-Party Logistics Providers (3PLs)
- Wholesale Distributors
- Supply Chain & Procurement Teams
- Market Research & Consulting Firms
- By Region
- North America
- Europe
- Asia Pacific (APAC)
- Latin America (LATAM)
- Middle East and Africa (MEA)
- By Component
- Market Size & Forecast, 2021-2032
- North America Retail Supply Chain Fragility Index Market
- Market Size & Forecast, 2021-2032
- By Value (USD Billion)
- Market Share & Forecast
- By Component
- By Deployment Mode
- By Enterprise Size
- By Retail Type
- By End User
- By Country
- United States
- By Component
- By Deployment Mode
- By Enterprise Size
- By Retail Type
- By End User
- Canada
- By Component
- By Deployment Mode
- By Enterprise Size
- By Retail Type
- By End User
- United States
- Market Size & Forecast, 2021-2032
- Europe Retail Supply Chain Fragility Index Market
- Market Size & Forecast, 2021-2032
- By Value (USD Billion)
- Market Share & Forecast
- By Component
- By Deployment Mode
- By Enterprise Size
- By Retail Type
- By End User
- By Country
- Germany
- By Component
- By Deployment Mode
- By Enterprise Size
- By Retail Type
- By End User
- United Kingdom
- By Component
- By Deployment Mode
- By Enterprise Size
- By Retail Type
- By End User
- Italy
- By Component
- By Deployment Mode
- By Enterprise Size
- By Retail Type
- By End User
- France
- By Component
- By Deployment Mode
- By Enterprise Size
- By Retail Type
- By End User
- Spain
- By Component
- By Deployment Mode
- By Enterprise Size
- By Retail Type
- By End User
- Belgium
- By Component
- By Deployment Mode
- By Enterprise Size
- By Retail Type
- By End User
- Russia
- By Component
- By Deployment Mode
- By Enterprise Size
- By Retail Type
- By End User
- The Netherlands
- By Component
- By Deployment Mode
- By Enterprise Size
- By Retail Type
- By End User
- Rest of Europe
- By Component
- By Deployment Mode
- By Enterprise Size
- By Retail Type
- By End User
- Asia Pacific Retail Supply Chain Fragility Index Market
- Market Size & Forecast, 2021-2032
- By Value (USD Billion)
- Market Share & Forecast
- By Component
- By Deployment Mode
- By Enterprise Size
- By Retail Type
- By End User
- By Country
- China
- By Component
- By Deployment Mode
- By Enterprise Size
- By Retail Type
- By End User
- India
- By Component
- By Deployment Mode
- By Enterprise Size
- By Retail Type
- By End User
- Japan
- By Component
- By Deployment Mode
- By Enterprise Size
- By Retail Type
- By End User
- South Korea
- By Component
- By Deployment Mode
- By Enterprise Size
- By Retail Type
- By End User
- Australia & New Zealand
- By Component
- By Deployment Mode
- By Enterprise Size
- By Retail Type
- By End User
- Indonesia
- By Component
- By Deployment Mode
- By Enterprise Size
- By Retail Type
- By End User
- Malaysia
- By Component
- By Deployment Mode
- By Enterprise Size
- By Retail Type
- By End User
- Singapore
- By Component
- By Deployment Mode
- By Enterprise Size
- By Retail Type
- By End User
- Vietnam
- By Component
- By Deployment Mode
- By Enterprise Size
- By Retail Type
- By End User
- Rest of APAC
- By Component
- By Deployment Mode
- By Enterprise Size
- By Retail Type
- By End User
- Latin America Retail Supply Chain Fragility Index Market
- Market Size & Forecast, 2021-2032
- By Value (USD Billion)
- Market Share & Forecast
- By Component
- By Deployment Mode
- By Enterprise Size
- By Retail Type
- By End User
- By Country
- Brazil
- By Component
- By Deployment Mode
- By Enterprise Size
- By Retail Type
- By End User
- Mexico
- By Component
- By Deployment Mode
- By Enterprise Size
- By Retail Type
- By End User
- Argentina
- By Component
- By Deployment Mode
- By Enterprise Size
- By Retail Type
- By End User
- Peru
- By Component
- By Deployment Mode
- By Enterprise Size
- By Retail Type
- By End User
- Rest of LATAM
- By Component
- By Deployment Mode
- By Enterprise Size
- By Retail Type
- By End User
- Middle East & Africa Retail Supply Chain Fragility Index Market
- Market Size & Forecast, 2021-2032
- By Value (USD Billion)
- Market Share & Forecast
- By Component
- By Deployment Mode
- By Enterprise Size
- By Retail Type
- By End User
- By Country
- Saudi Arabia
- By Component
- By Deployment Mode
- By Enterprise Size
- By Retail Type
- By End User
- UAE
- By Component
- By Deployment Mode
- By Enterprise Size
- By Retail Type
- By End User
- Qatar
- By Component
- By Deployment Mode
- By Enterprise Size
- By Retail Type
- By End User
- Kuwait
- By Component
- By Deployment Mode
- By Enterprise Size
- By Retail Type
- By End User
- South Africa
- By Component
- By Deployment Mode
- By Enterprise Size
- By Retail Type
- By End User
- Nigeria
- By Component
- By Deployment Mode
- By Enterprise Size
- By Retail Type
- By End User
- Algeria
- By Component
- By Deployment Mode
- By Enterprise Size
- By Retail Type
- By End User
- Rest of MEA
- By Component
- By Deployment Mode
- By Enterprise Size
- By Retail Type
- By End User
- Demand Outlook & Customer Adoption Dynamics
- Demand Evolution by End-Use Industry
- Purchasing Behavior & Supplier Selection Criteria
- Demand Visibility & Contracting Trends
- Regional Demand Concentration & Customer Clusters
- Competitive Landscape
- List of Key Players and Their Products
- Global Retail Supply Chain Fragility Index Company Market Share Analysis, 2025
- Competitive Benchmarking, By Operating Parameters
- Key Strategic Developments (Mergers, Acquisitions, Partnerships, etc.)
- Geopolitical Impact on Global Retail Supply Chain Fragility Index Market
- Company Profile
- IBM Corporation
- Introduction & Company Profile
- Product Benchmarking
- Strategic Outlook
- Key Personals
- Key Competitors
- Financial Analysis
- SWOT Analysis
- IBM Corporation
- Saudi Arabia
- Market Size & Forecast, 2021-2032
- Brazil
- Market Size & Forecast, 2021-2032
- China
- Market Size & Forecast, 2021-2032
- Germany
- Market Size & Forecast, 2021-2032
**(same data pointers will be provided for the below companies)
- SAP SE
- Oracle Corporation
- Microsoft Corporation
- Blue Yonder Group, Inc.
- Kinaxis Inc.
- Manhattan Associates, Inc.
- Infor
- Coupa Software Inc.
- Resilinc Corporation
- FourKites, Inc.
- Project44, Inc.
- Other Prominent Players
- Key Strategic Recommendations
- Research Methodology
- Qualitative Research
- Primary & Secondary Research
- Quantitative Research
- Market Breakdown & Data Triangulation
- Secondary Research
- Primary Research
- Breakdown of Primary Research Respondents, By Region
- Assumptions & Limitations
- Qualitative Research
*Financial information of case of non-listed companies can be provided as per availability.
**The segmentation and the companies are subject to modifications based on in-depth secondary research for the final deliverable
Frequently Asked Questions
1. What is the expected growth rate of the Global Retail Supply Chain Fragility Index Market during the forecast period?
Ans: The Global Retail Supply Chain Fragility Index Market size was estimated at USD 11.95 billion in 2025.
2. What is the expected growth rate of the Global Retail Supply Chain Fragility Index Market during the forecast period?
Ans: Global Retail Supply Chain Fragility Index Market is expected to grow at a CAGR of around 10.4% during the forecast period between 2026 and 2032.
3. What is the forecast value of the Global Retail Supply Chain Fragility Index Market by 2032?
Ans: The Global Retail Supply Chain Fragility Index Market is projected to reach a value of approximately USD 23.92 Billion by 2032.
4. What are the major factors driving the growth of the Global Retail Supply Chain Fragility Index Market?
Ans: The market is expected to experience significant growth between 2026 and 2032 because retail businesses increasingly use data-based decision-making and require dependable supply chain networks.
5. Name the key players operating in the Global Retail Supply Chain Fragility Index Market.
Ans: The key players of Global Retail Supply Chain Fragility Index Market are IBM Corporation, SAP SE, Oracle Corporation, Microsoft Corporation, Blue Yonder Group, Inc., Kinaxis Inc., Manhattan Associates, Inc., Infor, Coupa Software Inc., Resilinc Corporation, FourKites, Inc., and Project44, Inc., and other prominent players.
6. Which is the fastest-growing end user segment in the Global Retail Supply Chain Fragility Index Market?
Ans: The Retailers segment will lead market growth throughout the forecast period because businesses require better systems to handle their stock and protect themselves from potential dangers.
7. Which region contributes significantly to the growth of the Global Retail Supply Chain Fragility Index Market?
Ans: North America will experience substantial growth in the Global Retail Supply Chain Fragility Index Market during the forecast period because the region possesses advanced retail infrastructure and has implemented digital supply chain technologies since their initial development.